Biology, 06.01.2021 17:10 justinchou814
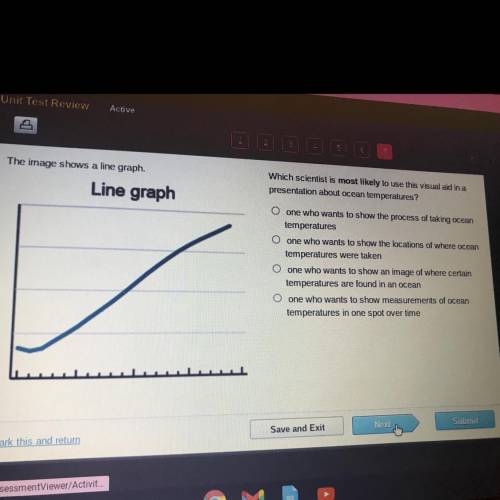
The image shows a line graph.
Line graph
Which scientist is most likely to use this visual aid in a
presentation about ocean temperatures?
O one who wants to show the process of taking ocean
temperatures
o one who wants to show the locations of where ocean
temperatures were taken
O one who wants to show an image of where certain
temperatures are found in an ocean
O one who wants to show measurements of ocean
temperatures in one spot over time


Answers: 2


Another question on Biology


Biology, 22.06.2019 04:00
Food contains a sugar called ( ), which is broken down in a process called cellular ( ). this process uses ( ) to break down food molecules and provide energy for cells. fill in the parentheses
Answers: 2

Biology, 22.06.2019 06:00
Which part of the neuron below is indicated by the arrow, and what is its function? hormones send chemical signals throughout the body to regulate other body processes. hormones are chemical signals that are sent throughout the body to regulate other body processes. hormones send electrical signals throughout the body to regulate other body processes. hormones are electrical signals that are sent throughout the body to regulate other body processes.
Answers: 2

Biology, 22.06.2019 11:00
If a grape were placed in a hypertonic solution what would happen and why?
Answers: 1
You know the right answer?
The image shows a line graph.
Line graph
Which scientist is most likely to use this visual ai...
Which scientist is most likely to use this visual ai...
Questions

Advanced Placement (AP), 09.12.2021 18:40


Mathematics, 09.12.2021 18:40


Chemistry, 09.12.2021 18:40

Health, 09.12.2021 18:40

Geography, 09.12.2021 18:40

Mathematics, 09.12.2021 18:40

Mathematics, 09.12.2021 18:40

English, 09.12.2021 18:40


Mathematics, 09.12.2021 18:40

Mathematics, 09.12.2021 18:40

Chemistry, 09.12.2021 18:40


Computers and Technology, 09.12.2021 18:40


