1 pts
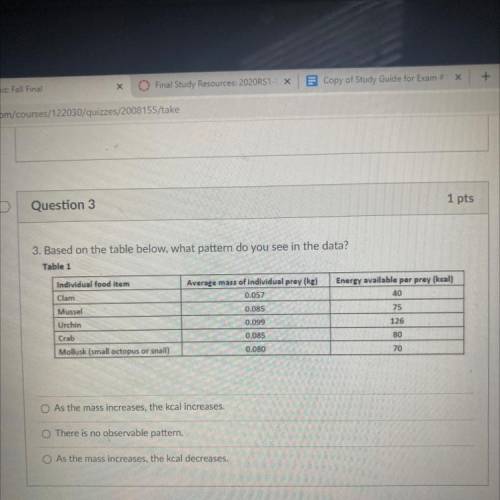
Question 3
3. Based on the table below, what pattern do you see in the data?
Tabl...

Biology, 17.12.2020 17:50 shaakiraak
1 pts
Question 3
3. Based on the table below, what pattern do you see in the data?
Table 1
Energy available per prey (kcal)
40
75
Individual food item
Clam
Mussel
Urchin
Crab
Mollusk (small octopus or snail)
Average mass of individual prey (ke)
0.057
0.085
0.099
0.085
0.080
126
80
70
As the mass increases, the kcal increases.
There is no observable pattern.
O As the mass increases, the kcal decreases.

Answers: 2


Another question on Biology
Biology, 21.06.2019 19:00
One statements is an example of a scientific observation. another statement is an example of a scientific explanation. identify the correct statement for each category to illustrate how scientific explanations are inferred from scientific observations.
Answers: 3
Biology, 22.06.2019 09:30
Phosgene is a chemical agent that is formed by decomposition of chlorinated hydrocarbon solvents by ultraviolet radiation. a. false b. true
Answers: 1
Biology, 22.06.2019 15:50
What process occurs during cellular development as the cell changes into a specific type of cell with specialized functions? a. binary fission b. fusion c. differentiation d. meiosis
Answers: 1
You know the right answer?
Questions


Geography, 14.05.2021 03:10

Physics, 14.05.2021 03:10


Mathematics, 14.05.2021 03:10

History, 14.05.2021 03:10

Computers and Technology, 14.05.2021 03:10
Mathematics, 14.05.2021 03:10

Spanish, 14.05.2021 03:10

Biology, 14.05.2021 03:10


