
Biology, 27.10.2020 16:30 montgomerykarloxc24x
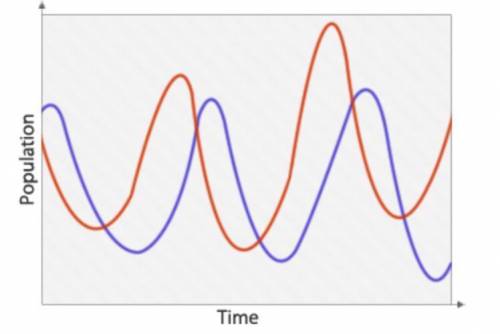
The chart below describes two different organisms living in the same ecosystem. Based on the information in the chart, which of the following is most likely the correct explanation of the relationship of the two organisms? (4 points)
A graph of population over time. Population is represented on the y axis. Time is represented on the x axis. A blue line is drawn rising and falling up and down over time, representing the population of one organism. A red line, representing the population of the second organism, is drawn rising and falling up and down over time with roughly the same shape as the blue line, but shifted slightly to the left.
a
Competitors for the same food
b
Predator and prey
c
An invasive species and a native species
d
Two types of prey hunted by the same predator

Answers: 3


Another question on Biology
Biology, 21.06.2019 23:00
Adigestive system that is a series of tubes beginning at the mouth and ending at the anus is a digestive system.
Answers: 1
Biology, 22.06.2019 09:30
Along what geographical feature are most of the oil producing regions located
Answers: 1
Biology, 22.06.2019 11:30
Use the distance formula to determine weather each pair of segments have the same length
Answers: 1
Biology, 22.06.2019 13:00
Ascientist wanted to formulate a pill to attack a specific type of bacteria that infects the throat. which biological component would be best to use as a model for the pill's function? bacteriocytes phagocytes complement antibodies
Answers: 1
You know the right answer?
The chart below describes two different organisms living in the same ecosystem. Based on the informa...
Questions

Chemistry, 22.07.2020 09:01

History, 22.07.2020 14:01

Spanish, 22.07.2020 14:01
History, 22.07.2020 14:01


Mathematics, 22.07.2020 14:01

Health, 22.07.2020 14:01

Computers and Technology, 22.07.2020 14:01
Spanish, 22.07.2020 14:01
Chemistry, 22.07.2020 14:01
History, 22.07.2020 14:01
Biology, 22.07.2020 14:01


