
Biology, 22.05.2020 18:01 blairjaneaoyrfvp
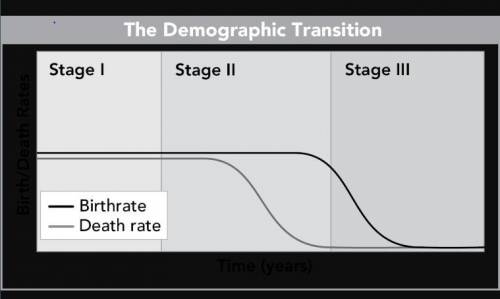
59. Demographers use graphs like this one to analyze patterns of population growth and decline.
The graph plots birthrate and death rate over time, in years. In Stage I, both rates begin relatively high. In Stage II, birth rate remains high while death rate decreases. At the end of Stage II and into Stage III, birthrate decreases to match the low death rate.
Suzie studies the graph and concludes that in Stage I and at the end of Stage III, the population of a country either is not changing size or is increasing slightly. Which assumption is necessary for Suzie’s conclusion to be accurate?
A. The population of the country did not increase substantially during Stage II.
B. The population of the country increased at least slightly during Stage II.
C. The population has a roughly equal distribution of people in age groups from ages 0 to 60 years.
D. The difference between the rates of immigration and emigration is insignificantly small.

Answers: 2


Another question on Biology
Biology, 22.06.2019 17:00
Mrna: gcuaauguc what amino acids does the mrna above code for? what type of amino acids or function are uag, uga, and uaa coding for? which codon (3 letters) signals translation to start and also codes for the amino acid methionine (met)?
Answers: 1
Biology, 22.06.2019 20:30
For each of the formulas, classify the formula as either an empirical formula, a molecular formula, or both. nahco3 empirical molecular both
Answers: 1
Biology, 23.06.2019 01:30
Alternation of generations in angiosperms the diagram below illustrates the alternation of generations that is characteristic of the angiosperm life cycle. label structures and processes (using white labels), indicate whether different structures are haploid or diploid (using pink labels), and indicate the types of cell division that occur at different points in the life cycle (using blue labels). drag the labels to their appropriate locations on the diagram of the angiosperm life cycle. labels can be used once or more than once. use only white labels for white targets, pink labels for pink targets, and blue labels for blue targets. a. meiosisb. haploidc. mitosisd. ametophytee. pollinationf. meiosisg. haploidh. mitosisi. ametophytej. fertilizationk. zygotel. diploidm. sporophyte
Answers: 2
You know the right answer?
59. Demographers use graphs like this one to analyze patterns of population growth and decline.
Questions


Mathematics, 17.02.2021 07:50

Mathematics, 17.02.2021 07:50

Computers and Technology, 17.02.2021 07:50
Mathematics, 17.02.2021 07:50

Social Studies, 17.02.2021 07:50
History, 17.02.2021 07:50
History, 17.02.2021 07:50

World Languages, 17.02.2021 07:50
English, 17.02.2021 07:50
English, 17.02.2021 07:50
Computers and Technology, 17.02.2021 07:50


