06.01 Classification of Living Organisms
Linnaean Taxonomy Chart
Complete the char...

06.01 Classification of Living Organisms
Linnaean Taxonomy Chart
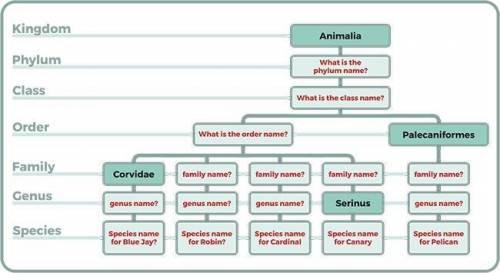
Complete the chart by researching online to fill in the missing classification boxes. Some have been filled in for you to guide you along the way. (1st Image)
Cladogram
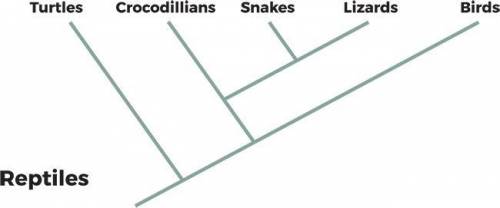
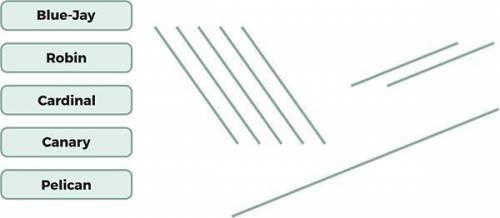
Create your cladogram below by using the birds listed in boxes and lines provided. You will need to arrange the boxes and lines how you best feel they should go. You may delete any extra lines you don’t need. Remember, there is no wrong way to make a cladogram. However, you must be able to explain why you have grouped them in such a way. Here’s a reminder of how a cladogram can look: (Last 2 Images)
Questions:
Using what you have learned in the lesson and the research assignment, answer the following questions in complete sentences.
Describe the physical traits your birds had in common with one another in your taxonomy chart. Break down your descriptions by taxa (kingdom, phylum, class, order…).
Example: All animals in the class Reptilia breathe air, lay shelled eggs, and have skin covered in scales.
Explain the positions of each species in your cladogram. Why did you place each of your animals in those positions?
Example: I started with the turtle and placed it furthest away from the other reptiles because it has a shell.
Which was more difficult to make, the taxonomy chart or the cladogram? Explain your answer.

Answers: 2


Another question on Biology
Biology, 22.06.2019 00:50
Ascientist separates a population of mice into two groups. what would most likely increase the rate of speciation in this population. a. teach the two groups different tricks b. allow the two groups to breed with each other c. put the two groups in different environment d. have the two groups live in identical ecosystems
Answers: 3
Biology, 22.06.2019 14:00
True or false: (a) the strings of little red dots represent carbohydrates. (b) the model is called a bilayer because there are two main types of molecules present, lipids and proteins. (c) the many black lines represent amino acid tails. (d) this model shows membrane transport. (e) the blue ovals are hydrophobic. (f) the blue ovals represent phospholipid heads.
Answers: 1
Biology, 22.06.2019 15:40
What evidence could be used to convince policy makers to change a shipping lane from going through a whale breeding ground? information on the number of all whale species currently alive information on the number of all whales hit by boats in the given area information on the number of whale deaths in the world's oceans information on the number of whale offspring born every year. (a) scientists could collect and combine data on fish populations all around the world to show that their populations are declining. (b) scientists collect and combine data on fish populations all around the world to show that their populations are increasing. (c) scientists work together and use past data to show that fish populations are becoming locally extinct in some areas. (d) scientists work together and use past data to show that some fish populations are adapting to environmental changes.
Answers: 1
Biology, 22.06.2019 16:40
What is the function of the nucleus in the euglena cells you observed?
Answers: 1
You know the right answer?
Questions

Biology, 31.07.2019 09:00

Geography, 31.07.2019 09:00
Mathematics, 31.07.2019 09:00

History, 31.07.2019 09:00
Mathematics, 31.07.2019 09:00

English, 31.07.2019 09:00
Mathematics, 31.07.2019 09:00


Business, 31.07.2019 09:00
English, 31.07.2019 09:00
Mathematics, 31.07.2019 09:00
Biology, 31.07.2019 09:00


