
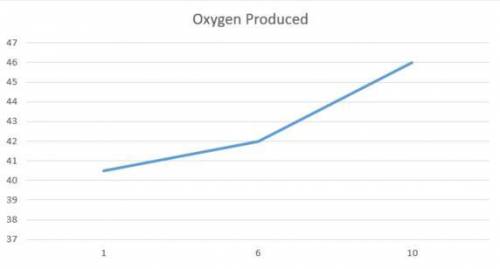
Gerald performed an experiment to determine if photosynthesis was affected by the amount of light that a plant received. the data from his experiment are shown in the table below.
amount of light number of plants average volume of oxygen
produced (ml)
(hours)
1 4 0.50
6 4 2.00
10 4 5.00
which format should he use to present his data?
bar graph
chart
line graph
pie graph

Answers: 2


Another question on Biology
Biology, 21.06.2019 22:40
Which sequence correctly shows the path of carbon dioxide during repiration?
Answers: 1
Biology, 22.06.2019 00:40
3points hurry! what is the relationship between biotechnology, sharkskin, and disease resistance? bioengineers have developed an artificial sharkskin that does not allow resistant bacteria to grow on it. disease-causing microbes have been genetically modified to keep them from infecting the skins of sharks. scientists have created a device that can be attached to the skins of sharks that dramatically increases their abilities to resist disease. sharkskin produces many chemicals that can be collected and used to create antibiotics.
Answers: 1
Biology, 22.06.2019 03:30
Explain how the number of similarities between the embryos from early stage to late stage is used as evidence of a common ancestry
Answers: 2
Biology, 22.06.2019 04:50
In this experiment, the was intentionally manipulated. it is the independent variable. the dependent variables that were measured were the
Answers: 3
You know the right answer?
Gerald performed an experiment to determine if photosynthesis was affected by the amount of light th...
Questions

English, 15.02.2022 01:10

Biology, 15.02.2022 01:10

English, 15.02.2022 01:10
Mathematics, 15.02.2022 01:10
Mathematics, 15.02.2022 01:10
English, 15.02.2022 01:10
Mathematics, 15.02.2022 01:20
Biology, 15.02.2022 01:20
Mathematics, 15.02.2022 01:20


