
Advanced Placement (AP), 30.11.2020 06:40 Leigh8655
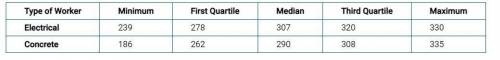
The following table shows summary statistics, in thousands, for the number of electrical workers and the number of concrete workers in the construction industry each month for the past 5 years. Based on the 1.5×IQR rule for outliers, which of the following statements is a correct comparison of the two distributions?

Answers: 2


Another question on Advanced Placement (AP)
Advanced Placement (AP), 23.06.2019 01:30
Need fast will mark brainliest ^^)based on the work you have completed in this lesson, you are going to create a transcript for a persuasive presentation to convince your client that your design improvement is the best possible solution for their needs. take your client through the different design options you considered for the product design improvement. explain why you discarded the designs that were not the best possible solution. finally, explain why your final product design covers each of the requirements and specifications you used to create your needs statement. your speech must include visual aids that include at least two schematics, or detailed illustrations, of your design. each schematic might show a different angle of your design. or the schematics might show different parts and pieces of the design. if you are unfamiliar with product schematics, find examples by doing an internet search for product schematicsno schematic neededcreate a transcript for a persuasive speech that includes schematics for your design.(just convince people to buy something anything you can think of use your own imagination)
Answers: 1
Advanced Placement (AP), 24.06.2019 22:30
Which of the following is not true about hydroelectricity a. use of gravitational force of flowing water b. its the most widely used renewable energy c. it has a high output of co2 that fossil fuels d. it has no direct waste asap
Answers: 1
Advanced Placement (AP), 25.06.2019 15:00
Ahypothesis test is conducted with a significance level of 5%. the alternative hypothesis states that more than 65% of a population is right-handed. the p-value for the test is calculated to be 0.03. which of the following statements is correct? we can conclude that more than 3% of the population is right-handed. we cannot conclude that more than 65% of the population is right-handed. we can conclude that more than 65% of the population is right-handed. we can conclude that exactly 3% of the population is right-handed. there is not enough information given to make a conclusion.
Answers: 2
Advanced Placement (AP), 26.06.2019 04:00
Indicates a bal of .08 or higher. a. compulsive behavior b. weakened vision c. reduced control of vehicle speed d. loss of judgment
Answers: 1
You know the right answer?
The following table shows summary statistics, in thousands, for the number of electrical workers and...
Questions

Mathematics, 14.02.2020 04:07

English, 14.02.2020 04:07


Mathematics, 14.02.2020 04:07

Mathematics, 14.02.2020 04:07

Medicine, 14.02.2020 04:07
Mathematics, 14.02.2020 04:07
Mathematics, 14.02.2020 04:08

Computers and Technology, 14.02.2020 04:08


